


The bet that convinced me player props were more than a novelty was a “Player X to have 2+ shots on target” selection at 2.75. My analysis wasn’t complicated: the player was a left-footed winger playing against a right-back who’d been dribbled past more times than any other full-back in the division. The winger had three shots on target in the first half. The bet landed before the break, and the analytical process behind it was replicable in a way that match result bets rarely are.
Player props — individual statistical markets that go beyond goalscoring — have exploded in the UK over the past three years. Shots on target, total shots, tackles, fouls committed, cards received, passes completed, and even assists are now priced as standalone bets or as legs within bet builders. Football generates 1.1 billion pounds in gross gambling yield annually, and a growing share of that comes from bettors who prefer analysing individuals over teams.
The Prop Markets Available for English Football
Last season I spent an evening cataloguing every player prop market offered for a Saturday Premier League fixture. The count reached 47 distinct player-level markets for a single match. That depth simply didn’t exist five years ago.
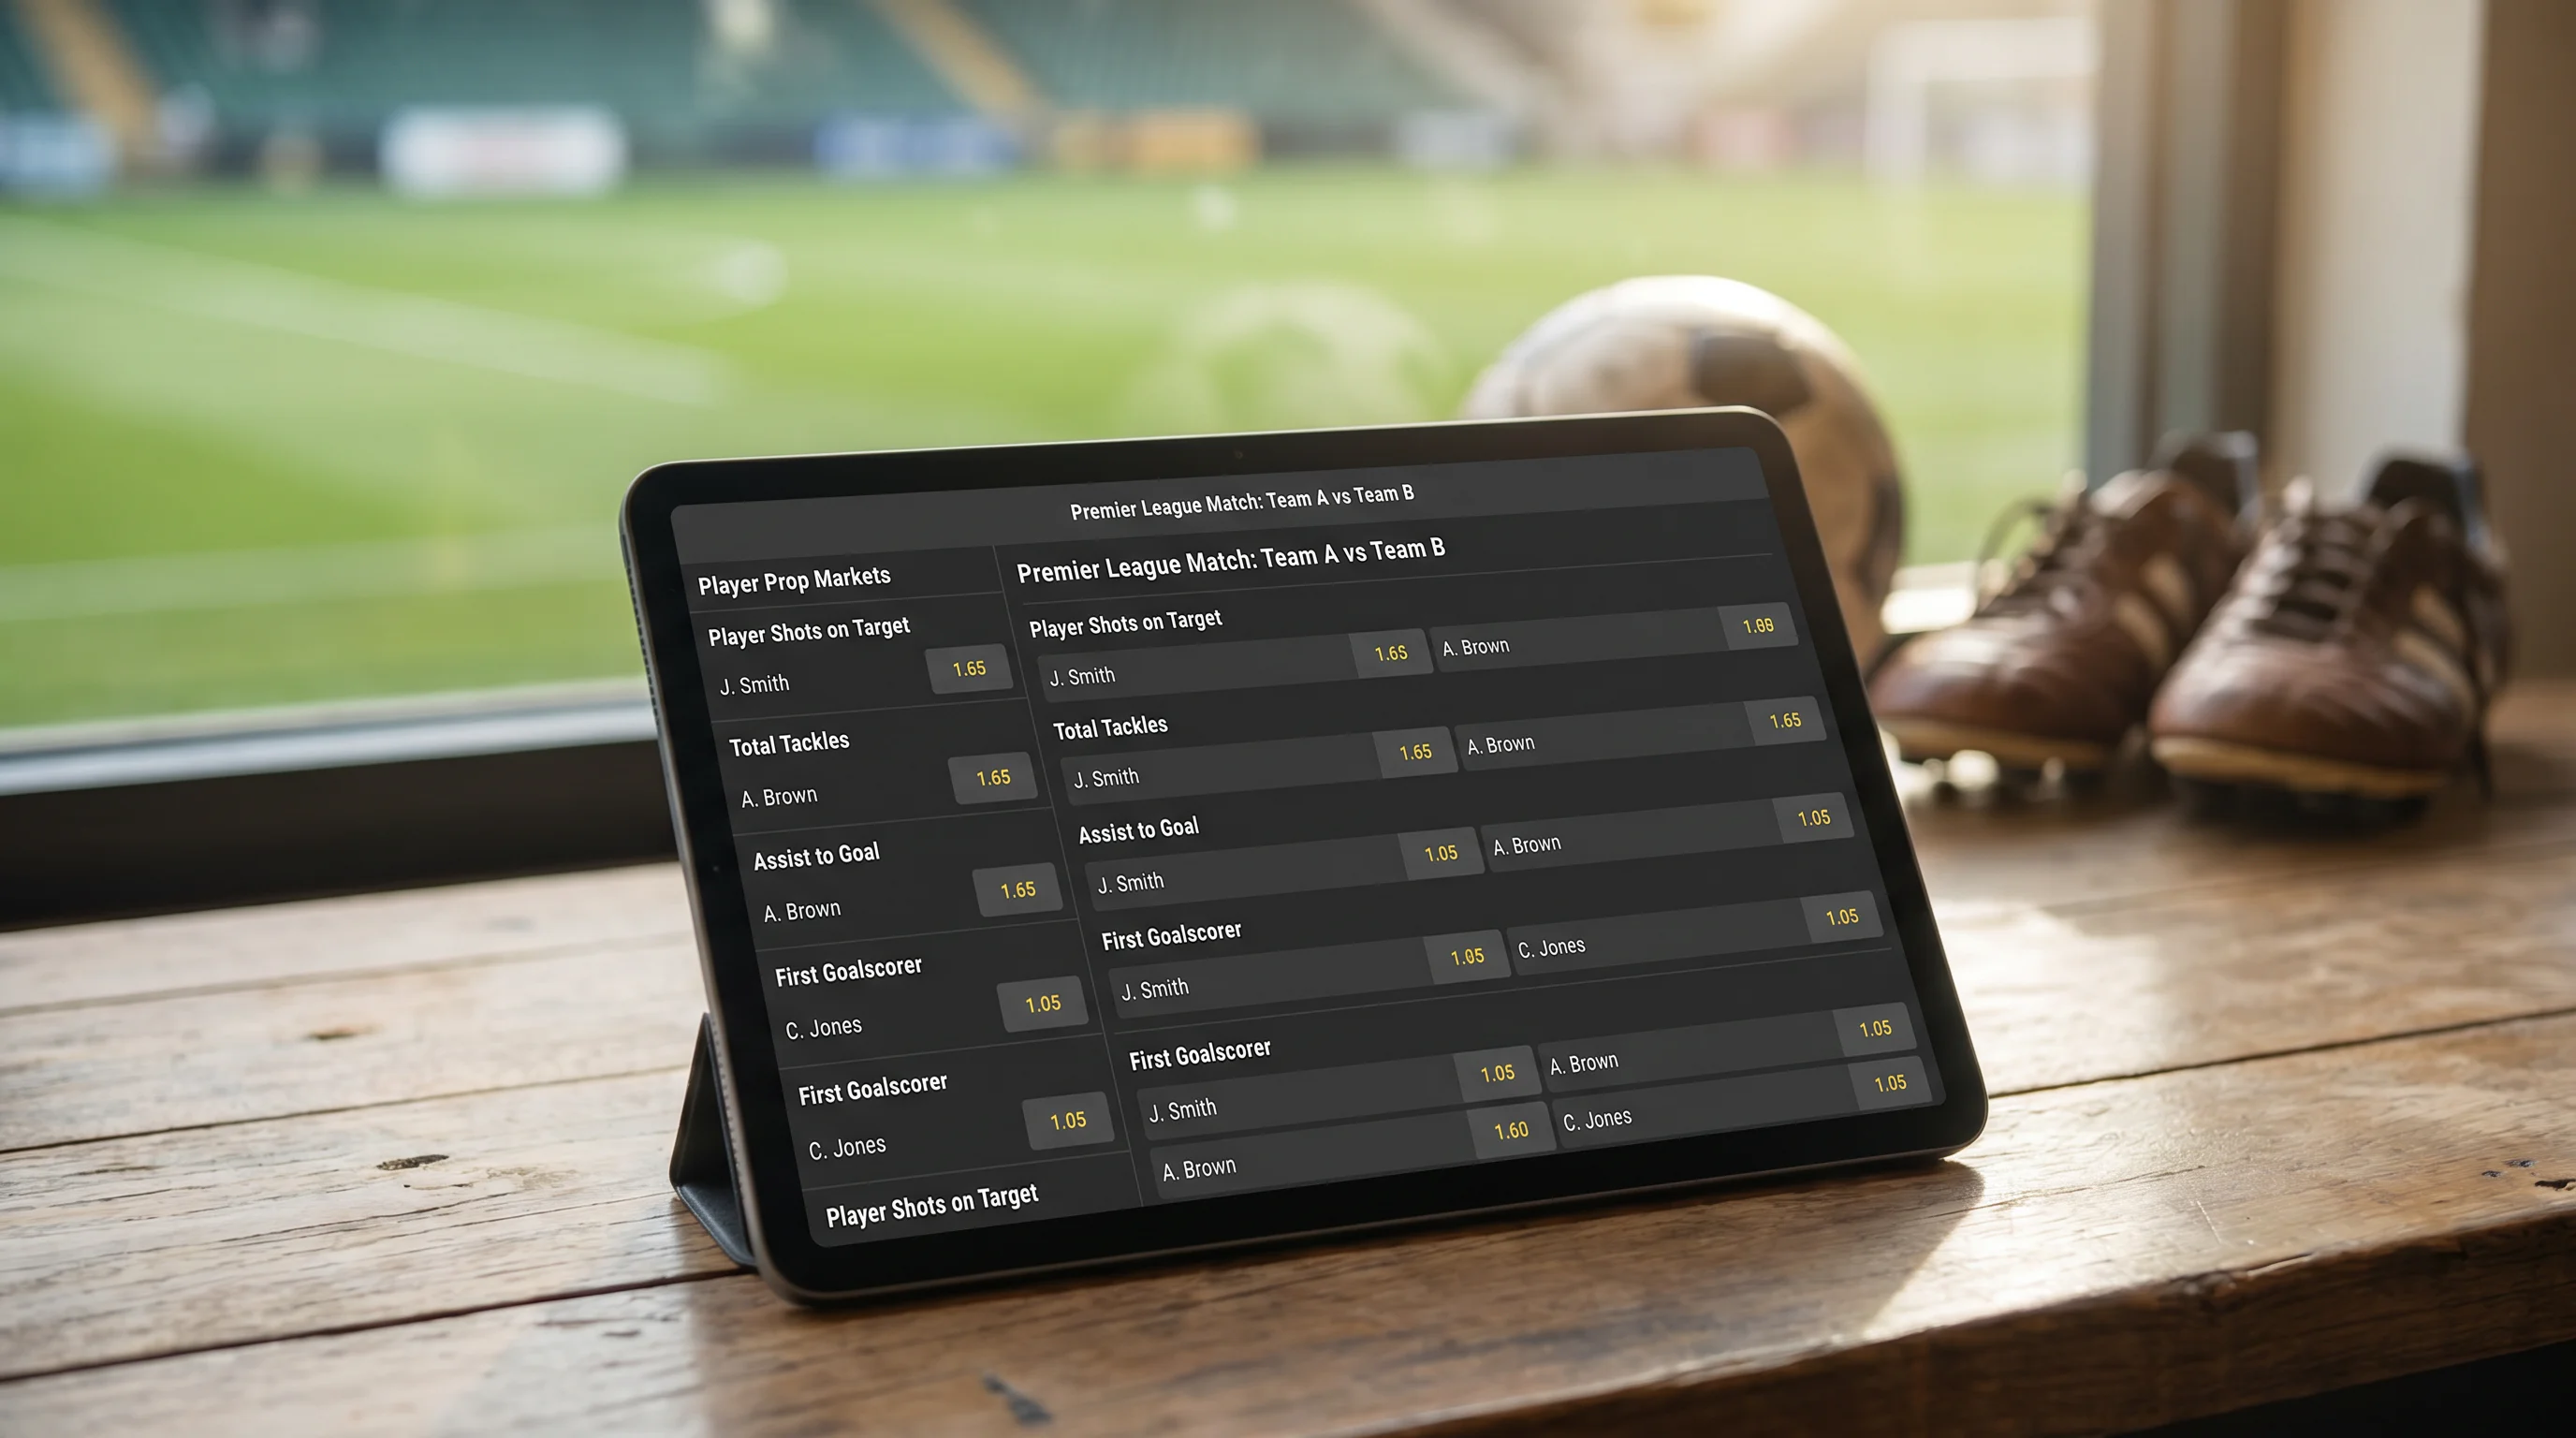
Shots markets are the most established category. You can bet on a player’s total shots (over/under a specified line, usually 1.5 or 2.5), shots on target (over/under 0.5 or 1.5), and in some cases the specific number of shots. Shots on target at 0.5 is the bread-and-butter prop: will this player register at least one shot on target during the match? For a striker at a top-six club, the implied probability typically sits around 60-70%, priced at 1.40-1.65. For a midfielder in a lower-table side, the implied probability drops to 30-40%, priced at 2.50-3.00.
Tackles and interceptions markets operate on similar over/under lines. Defensive midfielders and full-backs are the primary targets. Cards markets — player to be booked or player to be sent off — carry higher odds and higher variance, with a booking priced at 2.50-5.00 depending on the player’s disciplinary record, the match context, and the referee appointment. Lisa Nandy, the Secretary of State for Culture, Media and Sport, has spoken about ensuring that fans using betting sites can trust that those platforms are properly regulated — and that regulatory framework extends to how player props are settled and verified.
Data Sources That Separate Analysis From Guesswork
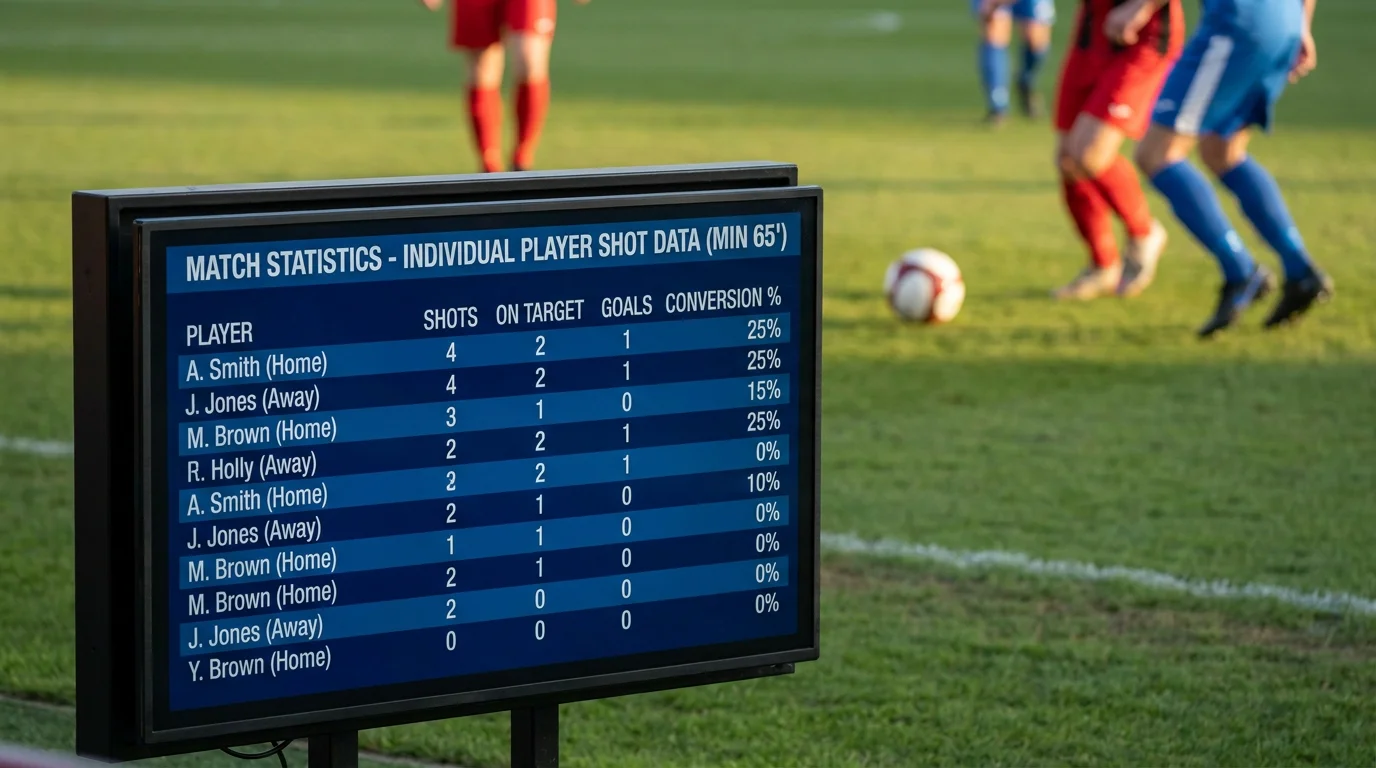
Player prop betting without data is gambling in the purest sense. With data, it becomes one of the most analytically rewarding markets in football. The distinction matters because the bookmaker’s prop pricing is algorithmically driven, and the algorithms rely on the same publicly available data you can access.
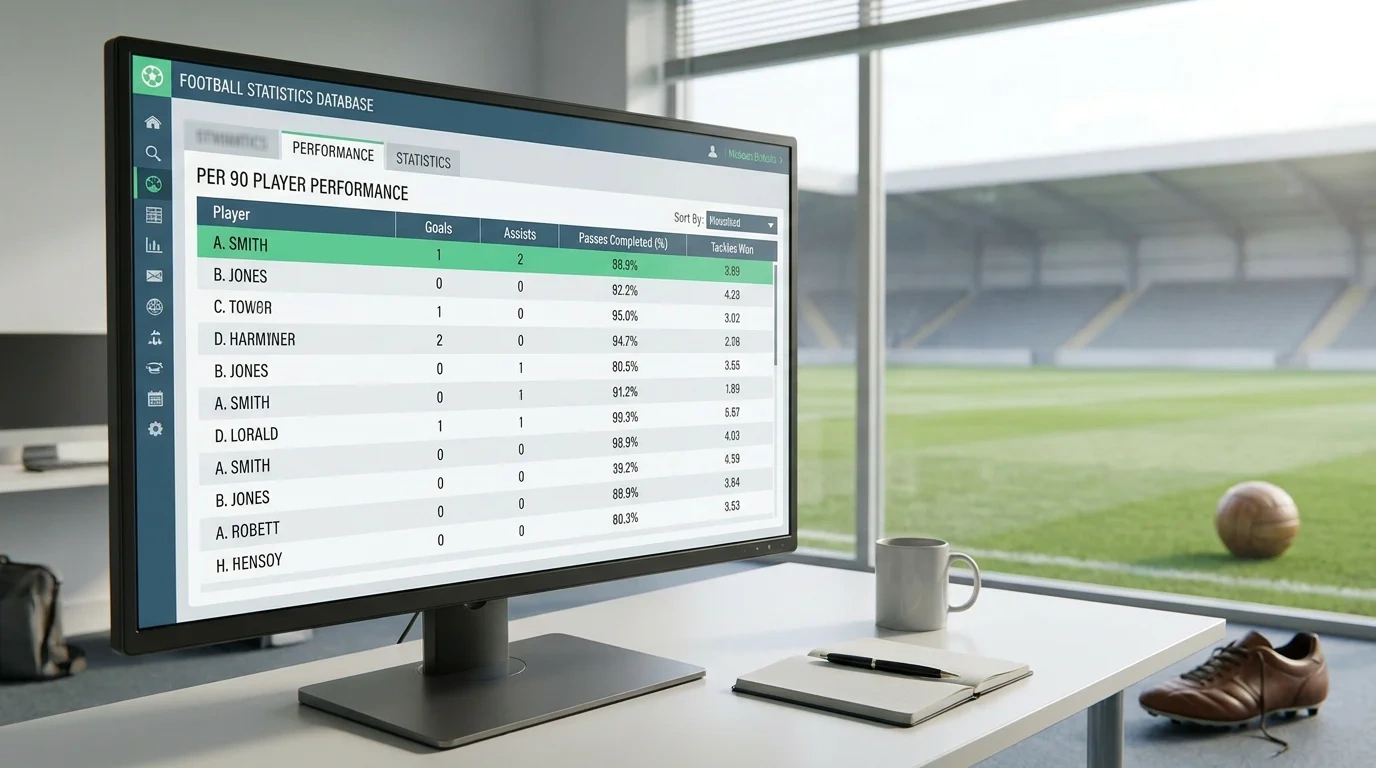
For shots markets, I use per-90-minute shot volume, shot map location, and expected goals from shots (xG per shot). A player averaging 3.2 shots per 90 minutes with a shots on target rate of 45% has a roughly 86% chance of recording at least one shot on target in a full match. If the bookmaker prices shots on target over 0.5 at 1.50 (implied 66.7%), that’s a substantial edge — but only if the player is likely to play 75+ minutes and the tactical matchup doesn’t suppress their shot volume.
For tackles, I cross-reference a player’s tackles per 90 with the opposition’s dribble attempt rate. A defensive midfielder who averages 3.5 tackles per match against a side that attempts 15+ dribbles per game is in an environment that elevates tackle opportunity above their baseline. This kind of matchup-specific adjustment is where human analysis adds the most value over the bookmaker’s algorithm, which tends to rely more heavily on season averages than fixture-specific context.
Cards Betting: High Variance but Identifiable Patterns
I approach cards markets differently from shots and tackles because the variance is fundamentally higher. A yellow card is a referee’s subjective decision, influenced by match temperature, prior incidents, and the specific official’s threshold for caution. No statistical model can capture that subjectivity completely.
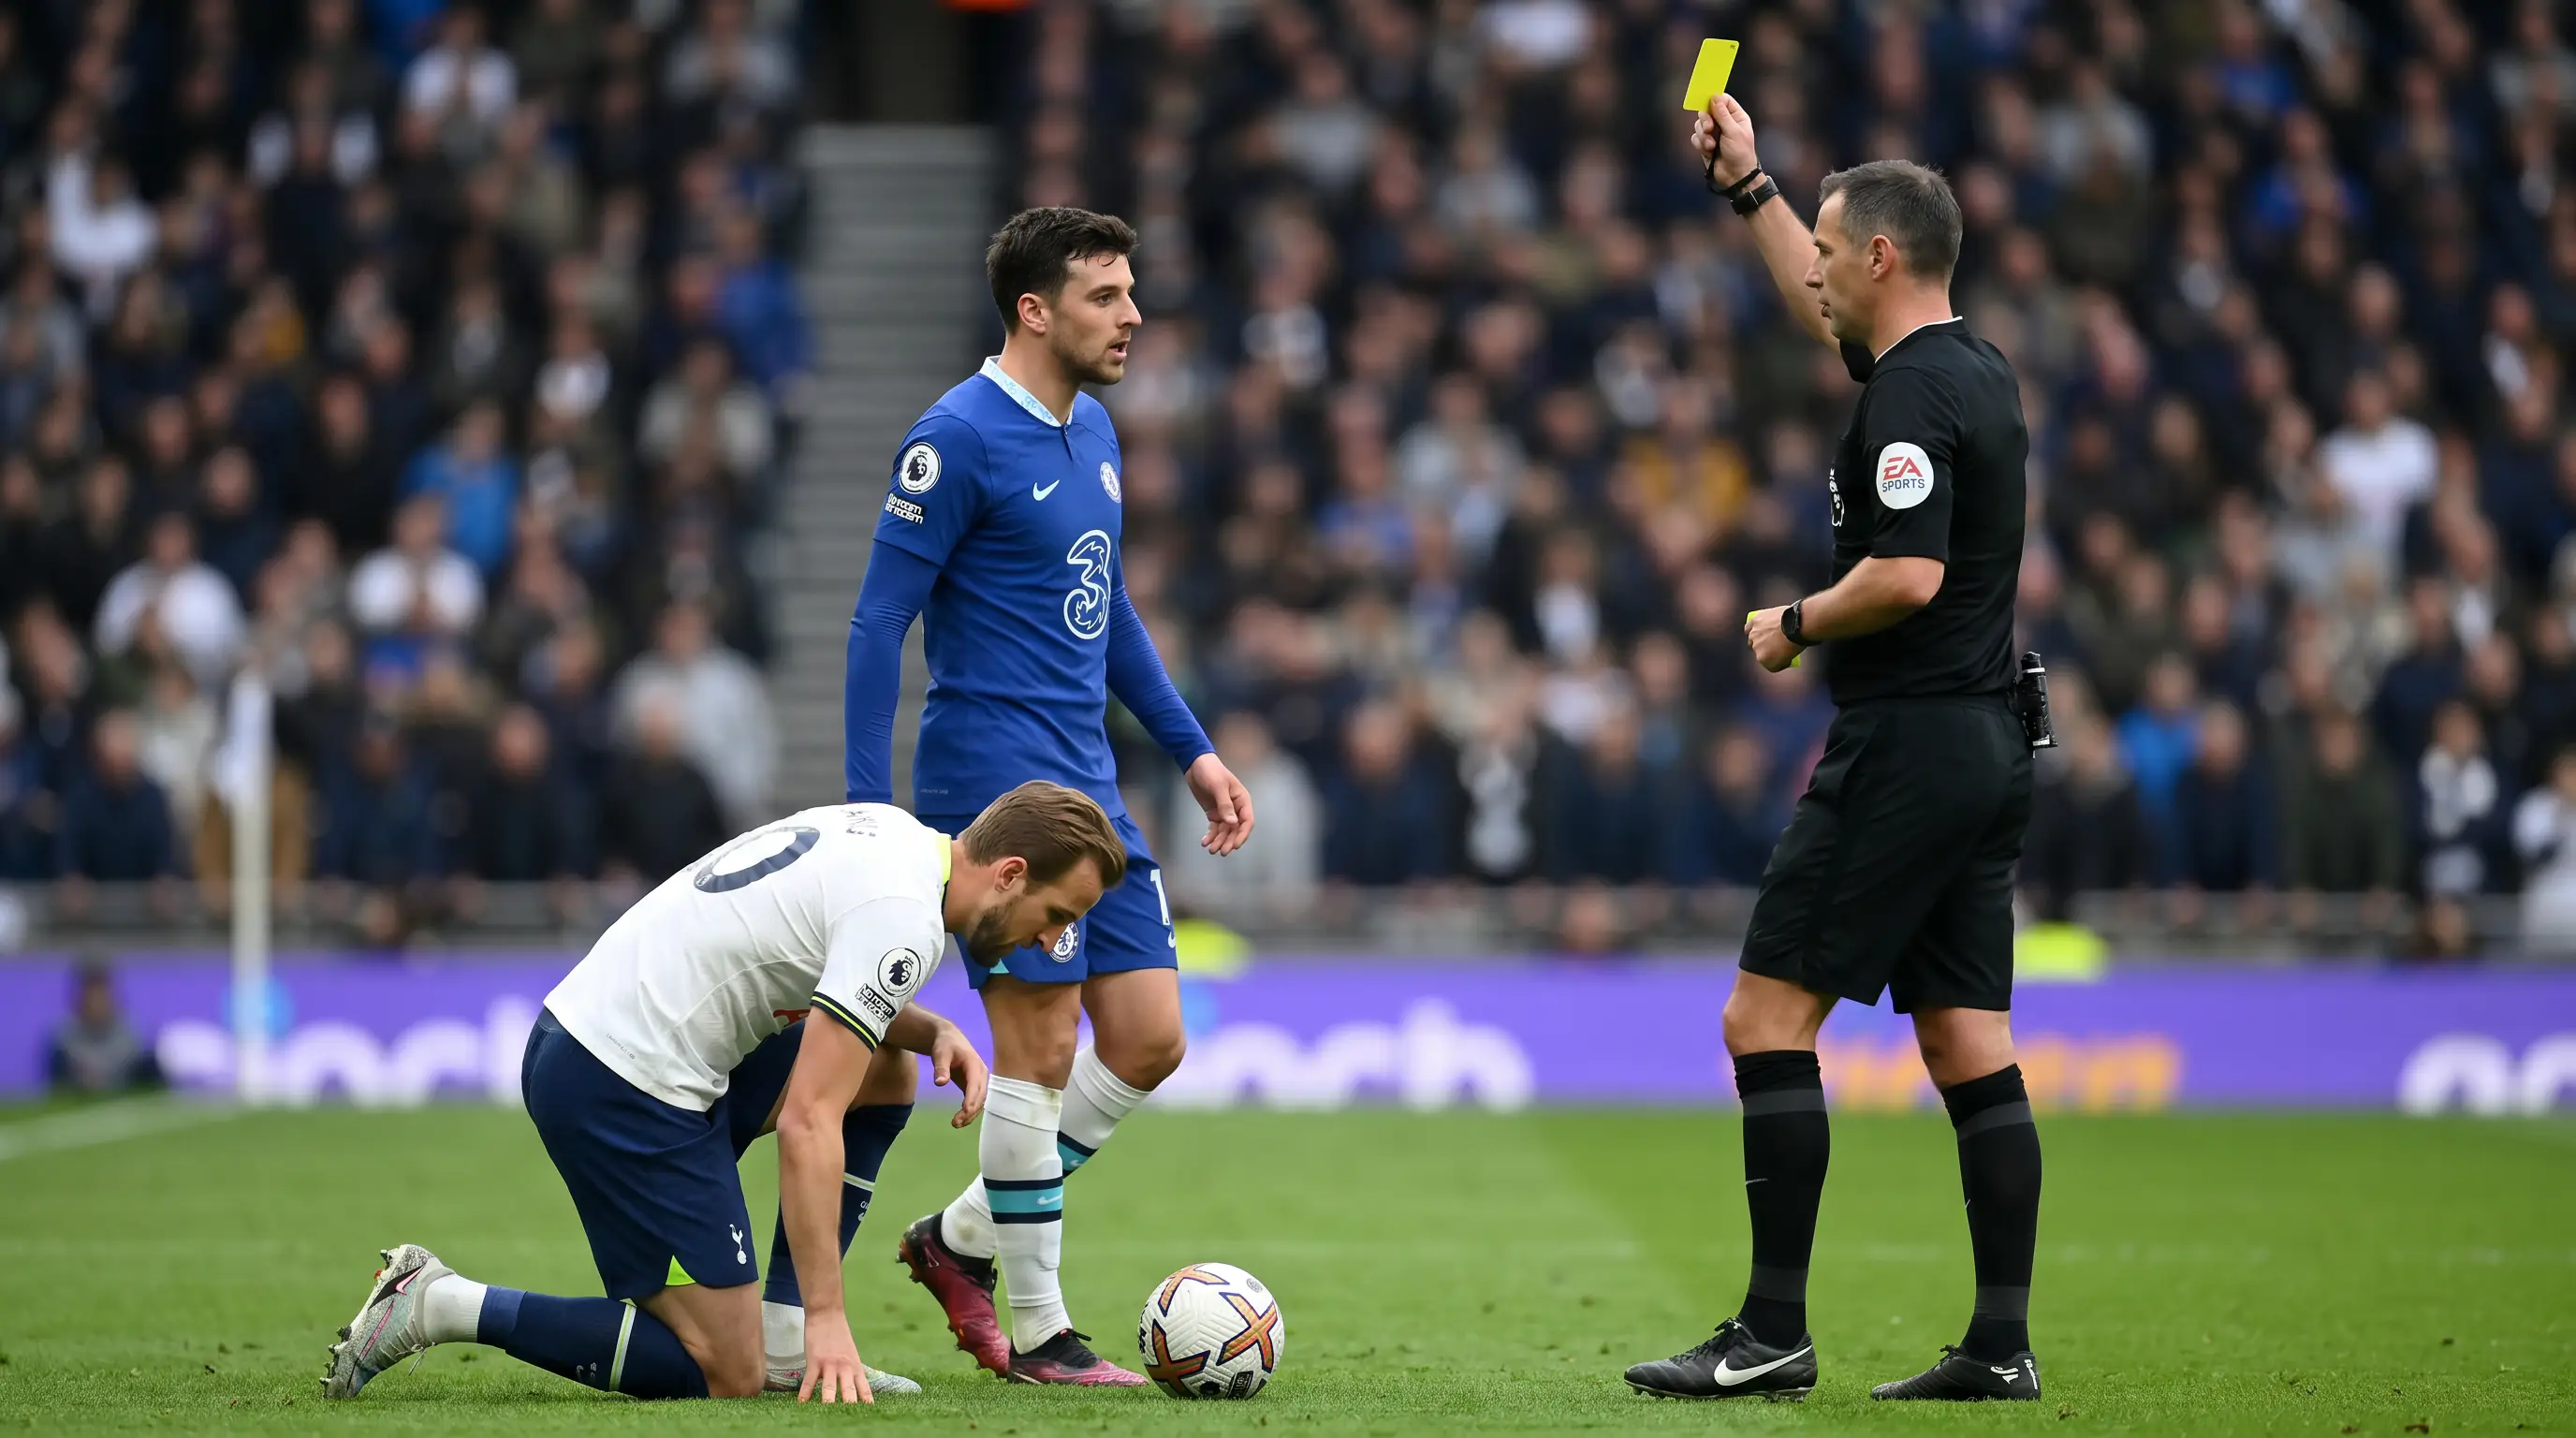
What the data can capture is the frequency with which certain players commit bookable offences. A full-back who averages 2.8 fouls per match is significantly more likely to be booked than one who averages 1.4 fouls, regardless of the referee. I track fouls per 90, fouls in the defensive third (which officials treat more severely), and the referee’s average cards per match. When all three indicators point in the same direction — a high-foul player, in a high-stakes fixture, officiated by a card-heavy referee — the “to be booked” price occasionally offers genuine value. Ten percent of the UK population bets on sport online, and cards markets attract a disproportionate share of casual bets driven by narrative rather than statistical analysis. That casual money keeps the prices wider than they’d otherwise be.
Integrating Props Into Bet Builders and Accumulators
Player props work best as standalone bets when the analytical edge is clear and the price justifies a single-market position. But they also serve as powerful bet builder legs when combined with match-level selections.
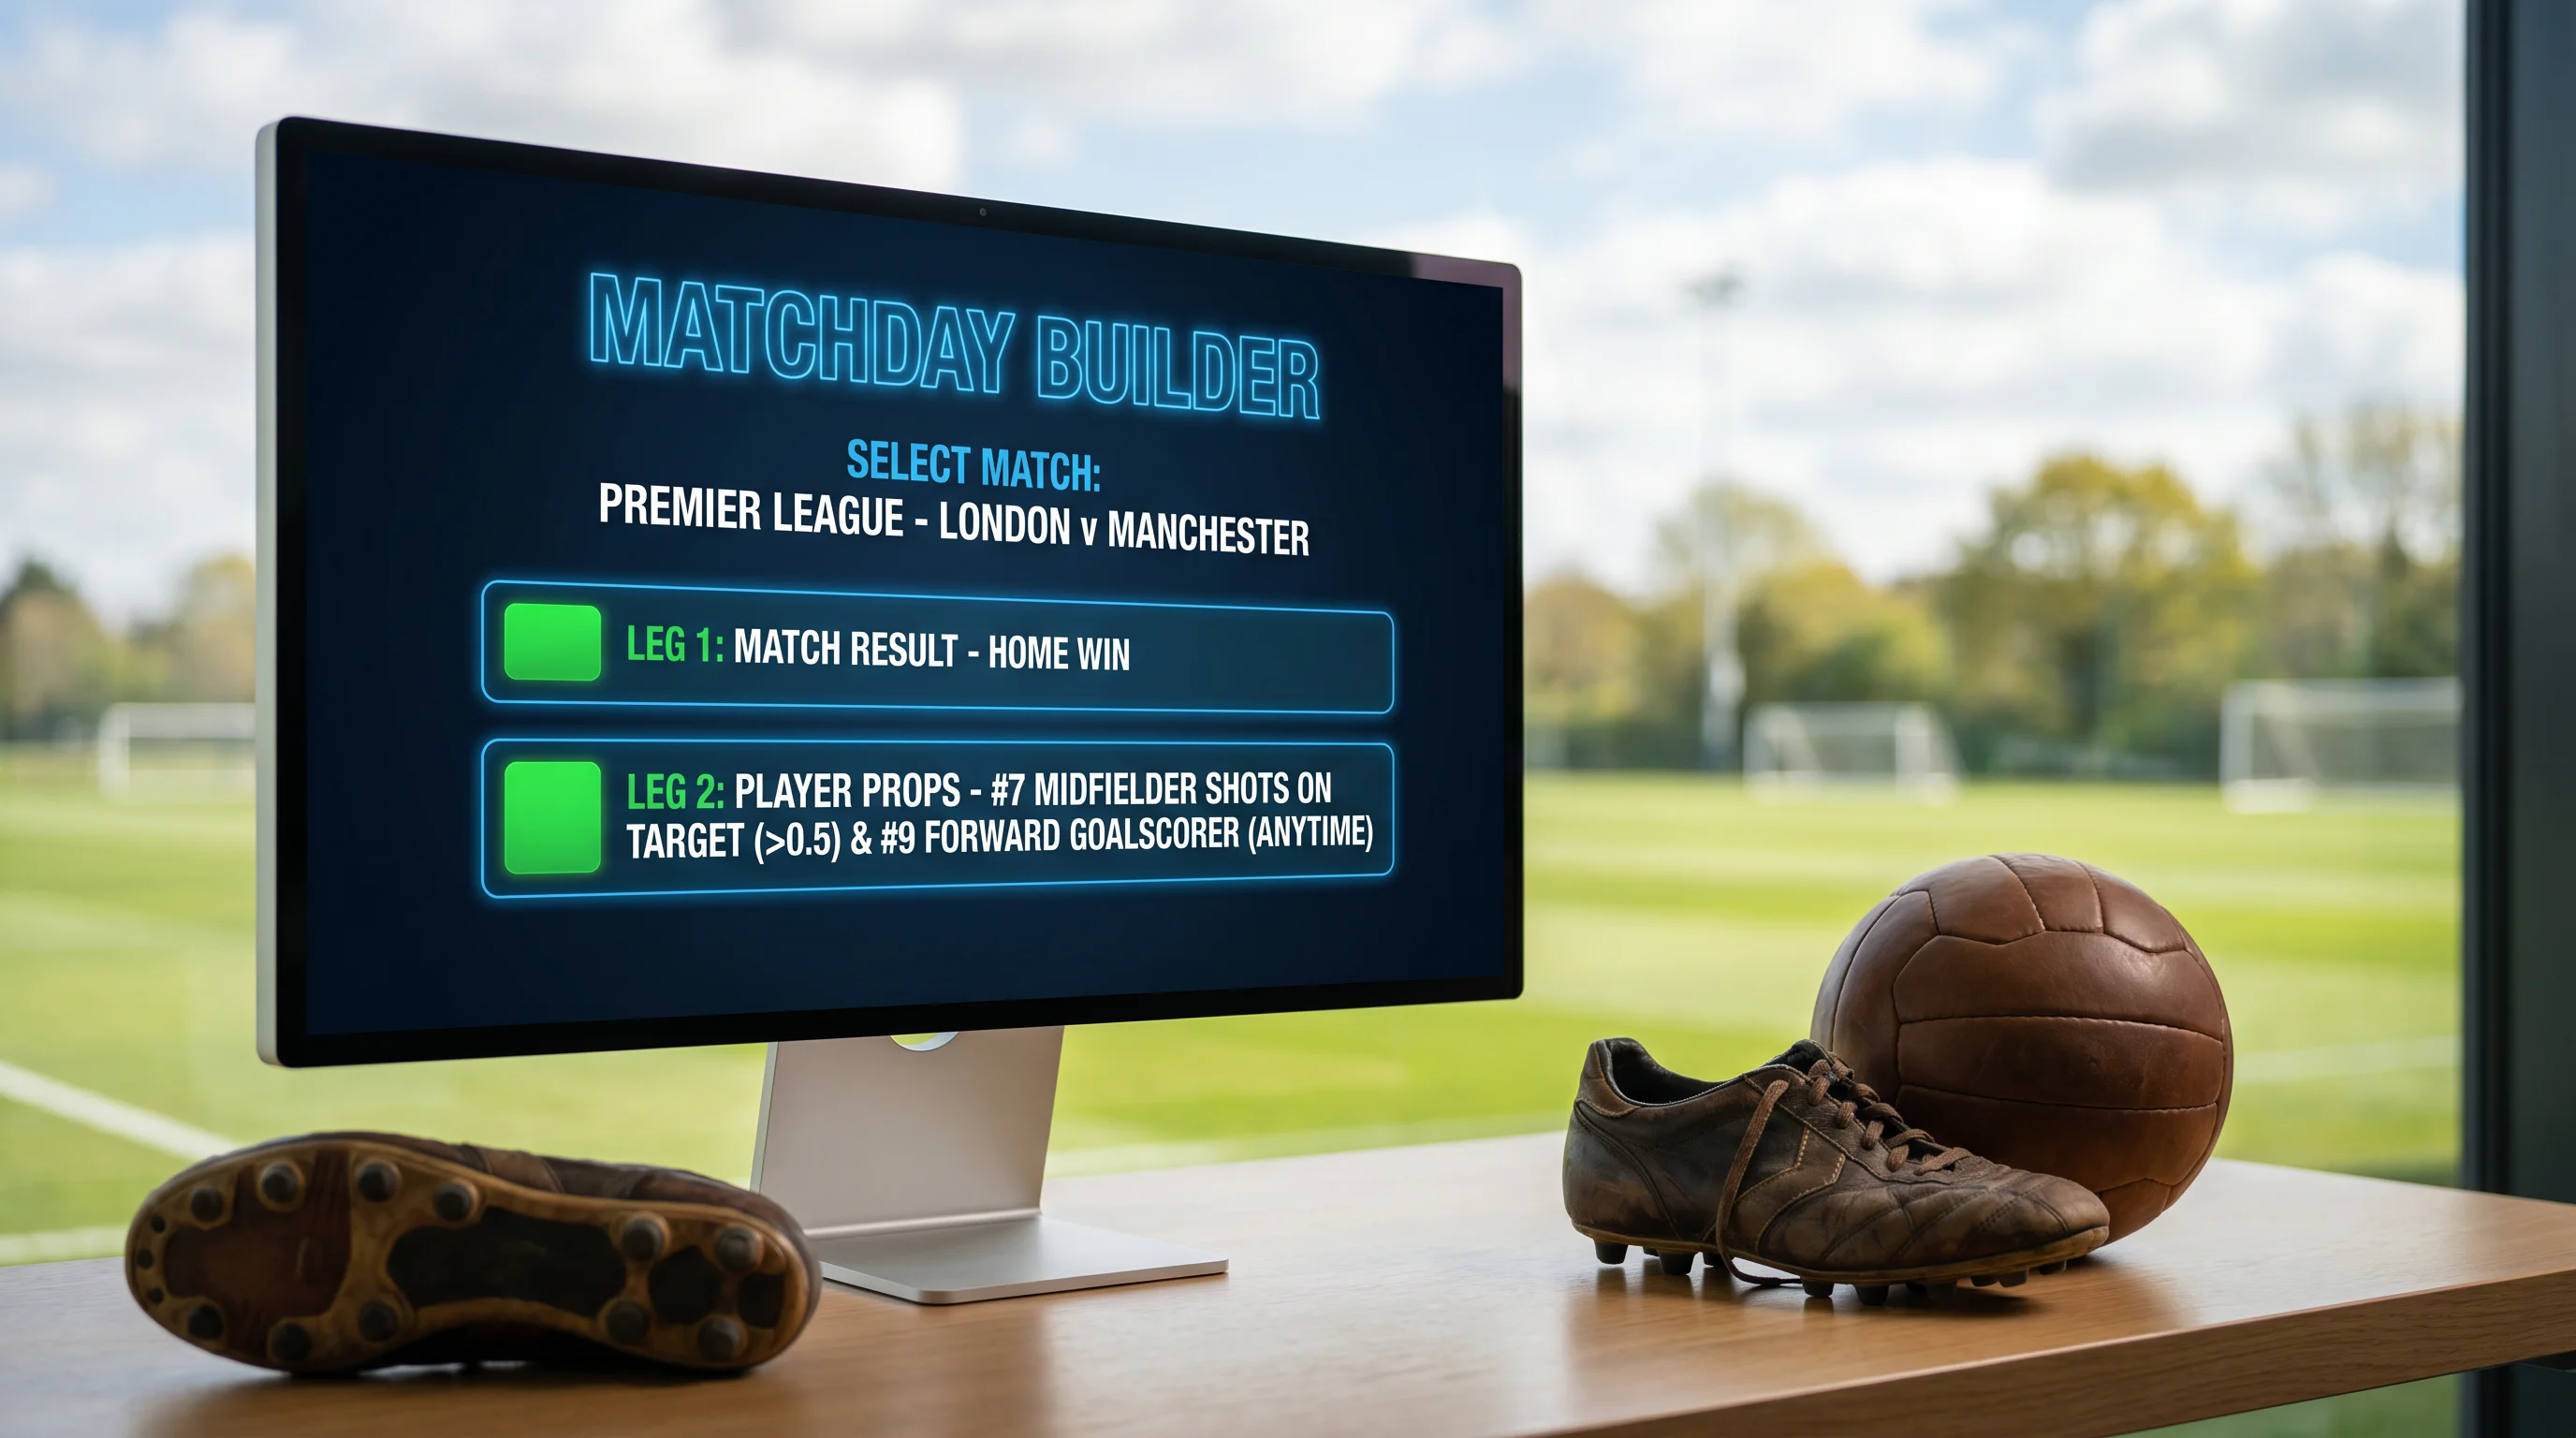
The correlation between a match result and a player’s shot volume is weaker than most bettors assume. A striker who averages 3 shots per match doesn’t suddenly average 5 because his team wins — the uplift is marginal, perhaps 0.3-0.5 additional shots. This weak correlation means that adding a player shots leg to a match result bet builder doesn’t attract as heavy a correlation discount as adding, say, over 2.5 goals to a home win. I exploit this by using shots on target props as my secondary bet builder legs, targeting players whose shot volume is relatively stable regardless of match state.
Tackles props, by contrast, have a stronger correlation with the opposition having more possession. If you’re backing a team to win and adding their defensive midfielder’s tackles over 2.5, the algorithm will adjust the combined odds more aggressively because a winning team often has less defensive work to do. Understanding these correlation dynamics — which props are weakly correlated with match outcome and which are strongly correlated — is the difference between using bet builders profitably and overpaying for correlated legs.
For the specific goalscoring subset of player markets, correct score betting goes deeper into the high-odds markets that sit alongside these broader prop offerings.
Articles
Created by the "leaguebettips.com" editorial team.
