

Both teams to score is the market that taught me to stop thinking about who wins and start thinking about what happens. Early in my betting career, I was obsessed with match result — home, draw, away. Then I started tracking BTTS rates across the English leagues and realised the bookmakers were consistently mispricing this market in specific contexts. That discovery shifted a meaningful portion of my weekly activity away from 1X2 and into a market where the patterns are clearer and the edges are more durable.
BTTS — also listed as GG/NG (Goal-Goal / No-Goal) on some platforms — is a binary market. Either both teams score at least one goal each, or they don’t. Football generates £1.1 billion in gross gambling yield in the UK, and BTTS is one of the most popular secondary markets behind match result and over/under goals. Its simplicity is its strength: you don’t need to predict the winner, the scoreline, or the margin — just whether both nets will be hit.
How BTTS Works
You choose BTTS “Yes” or BTTS “No.” If both teams score at least once during the 90 minutes (plus stoppage time), BTTS Yes wins. If one or both teams fail to score, BTTS No wins. Extra time and penalties in cup matches don’t count — it’s strictly the regulation 90 minutes.
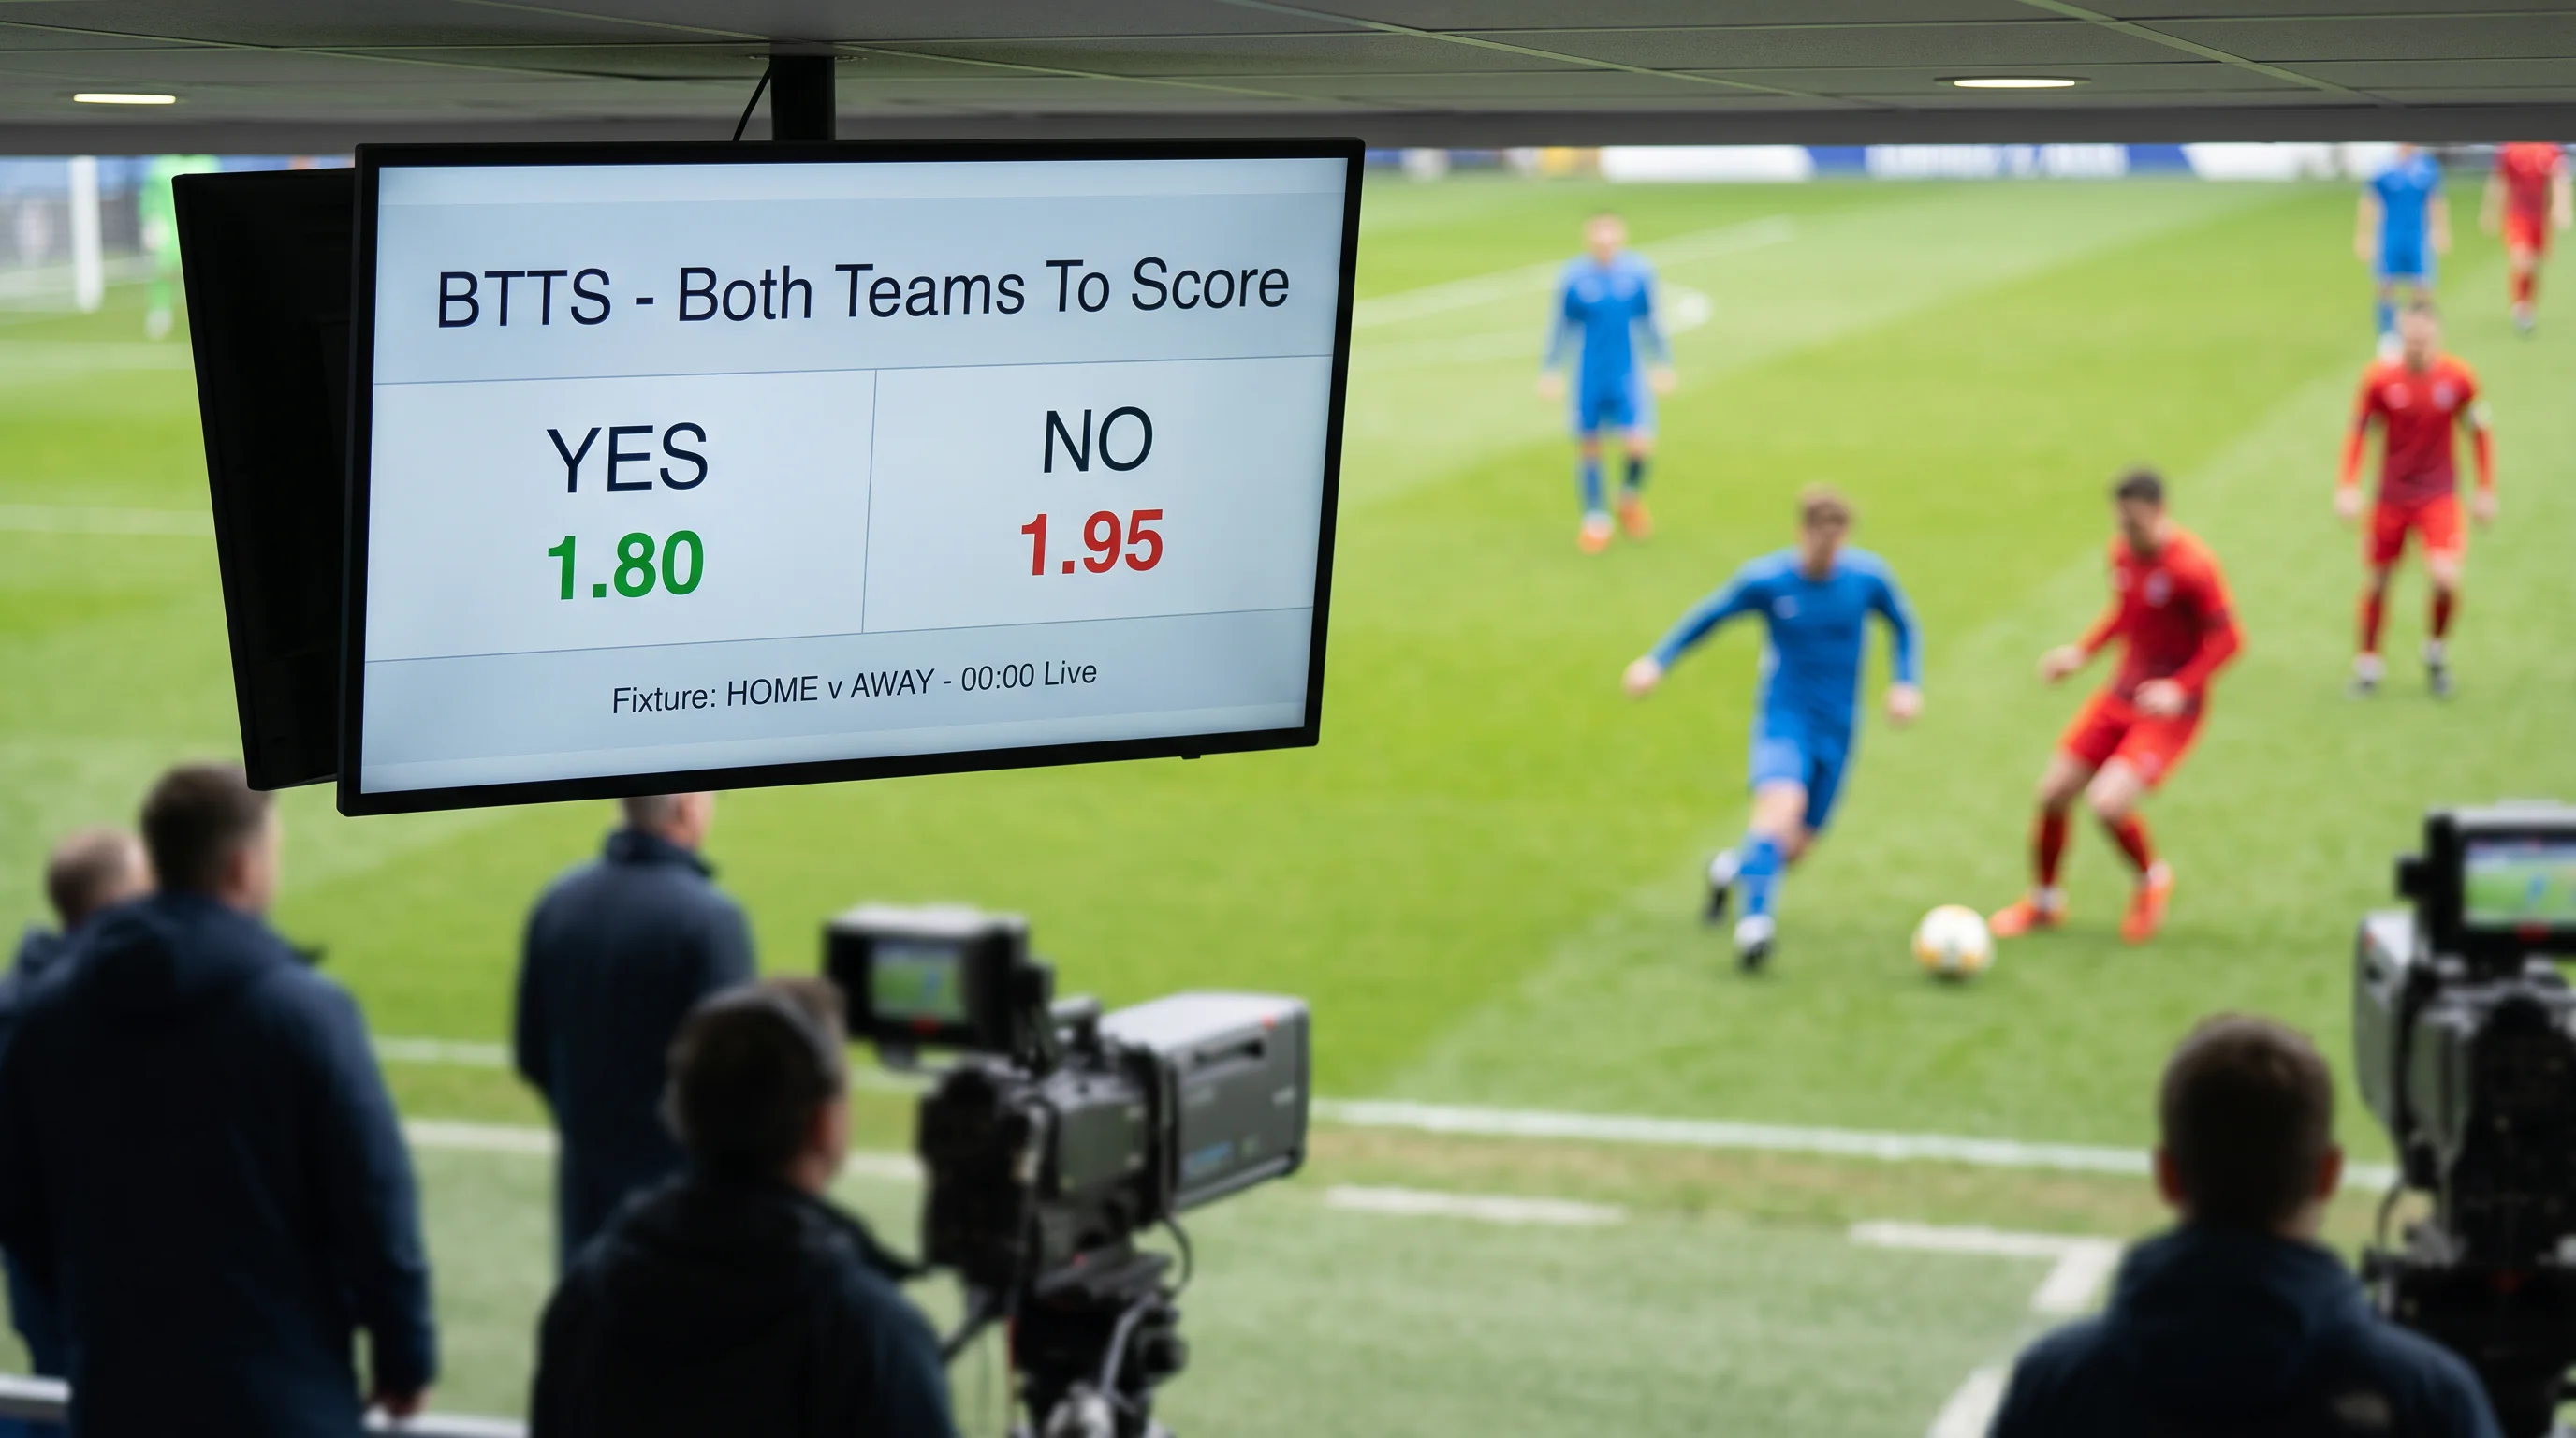
Typical pricing for a Premier League match sits around 1.70-1.85 for BTTS Yes and 1.90-2.10 for BTTS No. These prices imply that the bookmaker expects both teams to score in roughly 53-58% of matches, which is broadly consistent with historical Premier League data. The value, as always, lies in the matches where the actual probability deviates from what the odds suggest.
BTTS Rates by League: Where the Patterns Emerge
The most important variable in BTTS analysis is league context. The Premier League’s BTTS rate fluctuates between 48% and 54% depending on the season, driven by the quality of attacking play and the tactical trends of the era. The Championship produces slightly different numbers, with BTTS rates hovering around 50-53% in recent seasons.
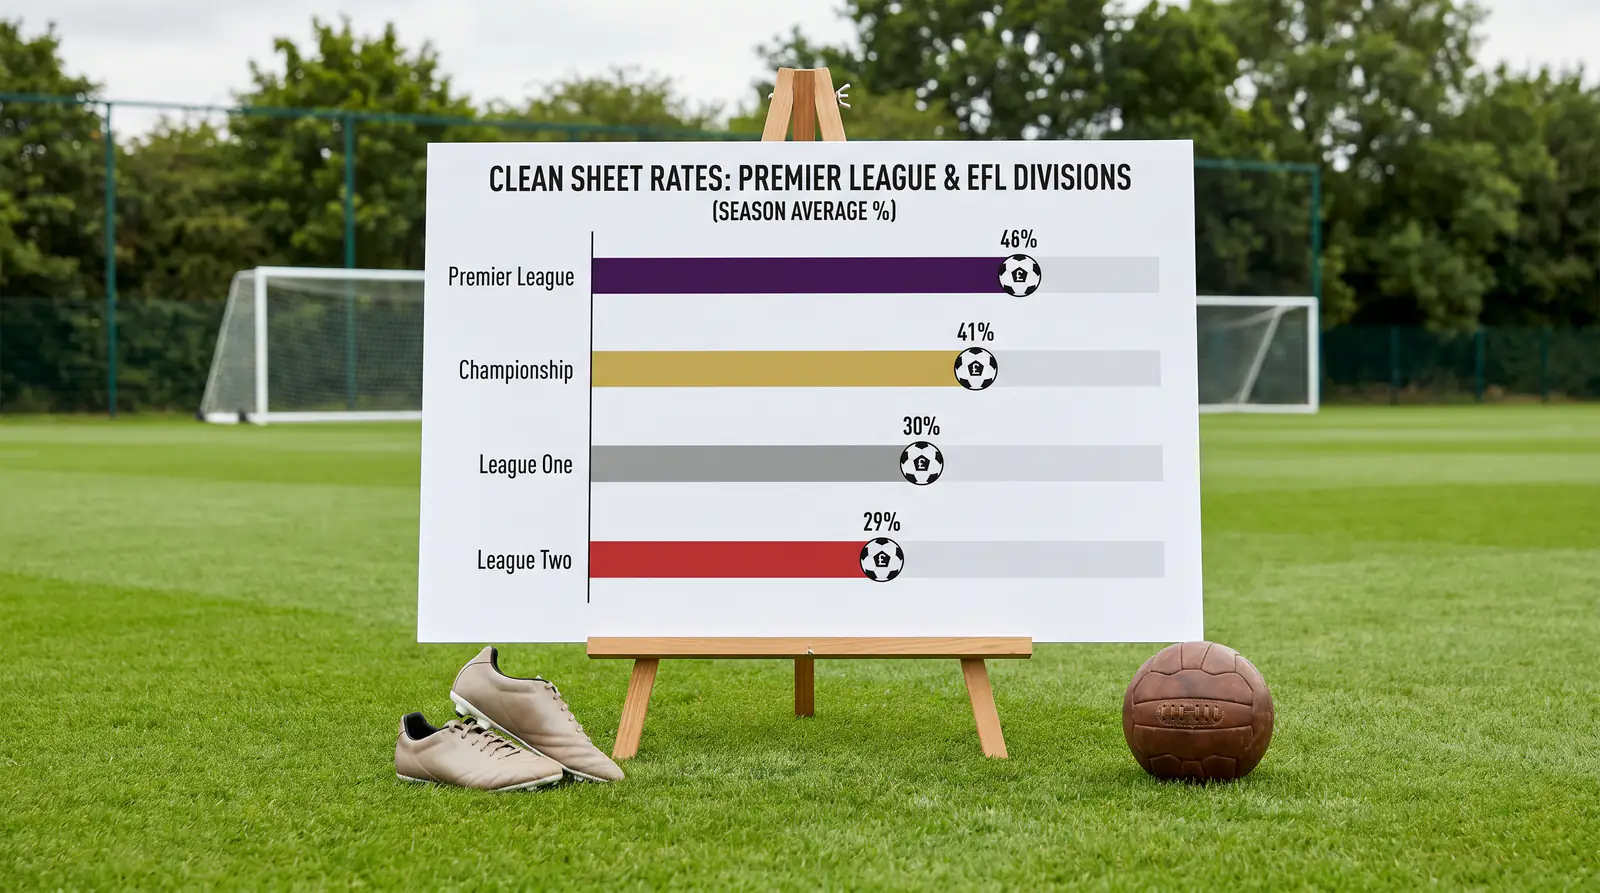
The sharpest pattern sits in the lower divisions. Draws are significantly more frequent in the lower EFL leagues than in the Premier League, and those draws split into two distinct categories: goalless draws (0-0) and low-scoring draws (1-1). The higher draw rate in League One and League Two doesn’t automatically mean higher BTTS rates — in fact, the increased frequency of 0-0 results in the fourth tier pushes the BTTS No rate higher than most bettors expect. GambleAware’s research has highlighted how different forms of gambling carry different risk profiles, and BTTS betting — with its binary simplicity and quick resolution — is one of the markets where bettors most frequently increase stake sizes without fully assessing the underlying probability.
I track BTTS rates on a rolling ten-match basis for every team in the Premier League and Championship. When a team’s recent BTTS rate diverges significantly from their season-long average — say, a side that’s been clean-sheeting regularly suddenly conceding in six straight matches — the market often hasn’t caught up, and BTTS Yes becomes temporarily mispriced.
BTTS Variants: And Win, And Over, And Under
Plain BTTS is just the starting point. Most operators offer combined BTTS markets that layer additional conditions onto the base bet. BTTS and Home Win requires both teams to score and the home side to win — a result like 2-1 or 3-2. BTTS and Over 2.5 Goals requires both teams to score and three or more total goals. These combinations carry higher odds because the additional condition reduces the probability, but they’re heavily correlated — if both teams score and the home side wins, the match has almost certainly produced over 2.5 goals anyway.

Live football attracts 6% of all UK adults as bettors, and BTTS variants have become a popular component of bet builders and accumulators. I use BTTS and Over 2.5 as a combined selection when my analysis points to an open, attacking fixture between two sides with poor defensive records. The correlation between the two legs means the combined odds aren’t as generous as they appear at first glance, but in the right context, the expected value still comes out positive.
When BTTS Offers Genuine Value
The purest value in BTTS comes from identifying defensive fragility that the odds haven’t priced in. A team might have a strong season-long defensive record but be missing their first-choice centre-back for a particular fixture. The match result odds might adjust — slightly shorter on the opposition winning — but the BTTS price often stays anchored to the season-long clean sheet rate rather than the specific defensive setup for that match.
Conversely, BTTS No offers value when two sides with moderate attacking output meet in a fixture with low tactical incentive for open play. Mid-table matches in December and January, where neither team is chasing promotion or fighting relegation, consistently produce more clean sheets than the season average. I’ve found the BTTS No price in these contexts to be the most reliable BTTS bet in my entire approach — not every week, but as a specific fixture profile that I target deliberately.
Set piece vulnerability is the variable most BTTS bettors overlook. A side that defends open play competently but concedes from corners and free kicks at an above-average rate will have a lower clean sheet percentage than their open-play metrics suggest. I’ve tracked set piece concession rates across the Premier League for five seasons, and the gap between the best and worst sides in the division is wider than most analysts realise. Mobile devices now account for 71% of all online bets in the UK, and the quick in-app BTTS selection often happens without this kind of granular defensive breakdown — which is exactly where the mispricing lives.

For a related market that overlaps significantly with BTTS analysis, over under goals betting takes the total goals angle and explores it across the English league system.
Articles
Prepared by the leaguebettips.com editorial staff.
